
Welcome to Data Visualization & Storytelling: The Best All-in-One Guide! This course is specifically designed to help individuals unlock the power of data by mastering Excel’s charting and storytelling capabilities, transforming raw data into actionable insights.
Why Do I Need to Learn Data Visualization & Storytelling?
Data visualization is a crucial skill in today’s data-driven world. It enables professionals to communicate complex information in a clear, engaging, and impactful way. This course will equip you with the tools and techniques needed to turn raw data into meaningful stories.
-
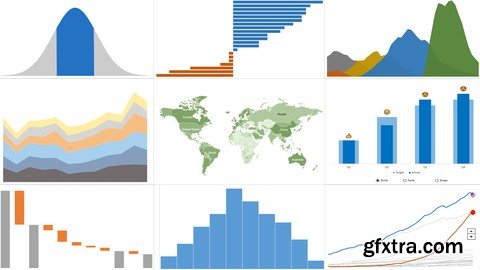
Effective Data Presentation: Learn how to create visually compelling charts such as column, bar, pie, line, waterfall, histogram, and combo charts. These visual tools help break down complex data for better understanding.
-
Interactive Data Exploration: Learn how to add interactivity to your charts using Excel’s features such as dropdown lists, radio buttons, checkboxes, spin buttons, and scroll bars, making your visualizations dynamic and user-friendly.
-
Tell Data-Driven Stories: Master the art of data storytelling by crafting narratives that highlight key insights, making data more memorable and actionable for your audience.
-
Improved Decision Making: By learning to visualize data effectively, you'll be able to support data-driven decisions in your personal or professional life, leading to better outcomes.
Why Should I Enroll in This Course?
Whether you're a beginner or already working with data, this course offers a practical, hands-on approach to mastering data visualization and storytelling. You’ll gain skills that are in high demand across industries, including business, marketing, research, and more.
-
No Experience Required: Whether you’re new to Excel or an experienced user, this course is designed for all skill levels. We’ll guide you through each concept step-by-step.
-
Create Interactive and Dynamic Visuals: Learn how to build interactive charts in Excel, adding value to your data presentations by allowing users to explore different scenarios with ease.
-
Master Data Storytelling: Transform raw data into compelling stories that drive decision-making and captivate your audience. This is a highly sought-after skill that enhances your professional and personal projects.
-
Career-Boosting Skills: Data visualization is a highly valuable skill that can elevate your career. The ability to convey data insights clearly is a key asset for professionals in virtually every field.
-
Real-World Applications: By the end of the course, you'll have the expertise to create polished, interactive, and insightful data visualizations for business, personal, or academic use.
30-Day Money-Back Guarantee!
Your investment is risk-free with our 30-day money-back guarantee. If, for any reason, you're not satisfied with the course content or delivery, you can request a full refund within the first 30 days. We're confident that this course will empower you with the skills to transform data into powerful visual stories.

Data_Visualization_&_Storytelling_The_Best_All-in-One_Guide.part2.rar

Top Rated News
- Sean Archer
- John Gress Photography
- Motion Science
- AwTeaches
- Learn Squared
- PhotoWhoa
- Houdini-Course
- Photigy
- August Dering Photography
- StudioGuti
- Creatoom
- Creature Art Teacher
- Creator Foundry
- Patreon Collections
- Udemy - Turkce
- BigFilms
- Jerry Ghionis
- ACIDBITE
- BigMediumSmall
- Boom Library
- Globe Plants
- Unleashed Education
- The School of Photography
- Visual Education
- LeartesStudios - Cosmos
- Fxphd
- All Veer Fancy Collection!
- All OJO Images
- All ZZVe Vectors
 Categories


