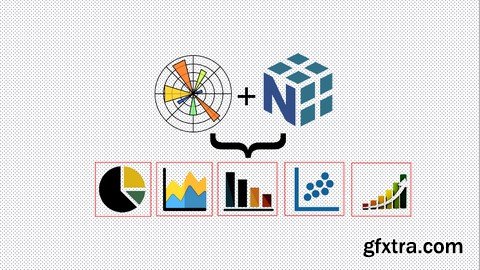
Top 10 data analytics course using matplotlib 2022, Top 10 data visualization course using matplotlib 2022, Matplotlib 2022
The data analytics is the process of finding insights of the data. It involves following important steps,
1. Collection of relevant data
2. Preprocessing and transforming data
3. Plotting data using different types of graphs
4. Understanding insight of the data
We can plot data in different types of plots using matplotlib library. Matplotlib is a cross-platform, data visualization and graphical plotting library for Python and its numerical extension NumPy. It along with python numpy package provides open source alternative to MATLAB. Developers can use matplotlib library for plotting graphs. Also they can use matplotlib’s APIs (Application Programming Interfaces) to embed plots in GUI based applications. In this course you are going to learn details of matplotlib library. The content of this course is as follows,
Chapter 1: Introduction to MatPlotLib
-
A. What is Matplotlib?
-
B. Pyploy API
-
C. PyLab Module
-
D. Simple Plot
Chapter 2: Object Oriented Matplotlib
-
A. Object oriented interface
-
B. Figure class
-
C. Axes class
-
D. Transforms
Chapter 3: Multiple Plots
-
A. Multiplots
-
B. Subplots function
-
C. Subplot2grid function
Chapter 4: Formatting Plots
-
A. Grids
-
B. Formatting axes
-
C. Setting limits
-
D. Setting ticks and tick labels
-
E. Twin axes
Chapter 5: Types of Plots
-
A. Bar plot
-
B. Stacked bar chart
-
C. Histogram
-
D. Pie chart
-
E. Scatter plot
-
F. Contour plot
-
G. Quiver plot
-
H. Box plot
-
I. Violin plot
Chapter 6: Three Dimensional Plotting
-
A. Three dimensional plotting
-
B. Three dimensional contour plot
-
C. Three dimensional wireframe plot
-
D. Three dimensional surface plot
Chapter 7: Working with Non Numeric Data
-
A. Working with text data
-
B. Working with mathematical expressions
-
C. Working with image data
Top Rated News
- Sean Archer
- John Gress Photography
- Motion Science
- AwTeaches
- Learn Squared
- PhotoWhoa
- Houdini-Course
- Photigy
- August Dering Photography
- StudioGuti
- Creatoom
- Creature Art Teacher
- Creator Foundry
- Patreon Collections
- Udemy - Turkce
- BigFilms
- Jerry Ghionis
- ACIDBITE
- BigMediumSmall
- Boom Library
- Globe Plants
- Unleashed Education
- The School of Photography
- Visual Education
- LeartesStudios - Cosmos
- Fxphd
- All Veer Fancy Collection!
- All OJO Images
- All ZZVe Vectors


 Categories


