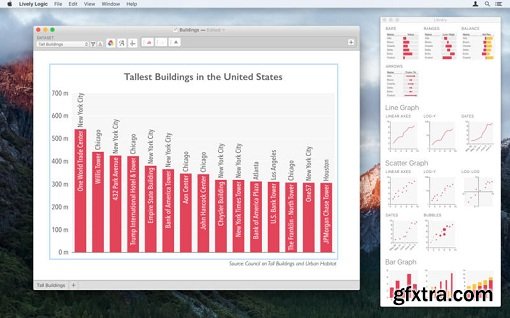
Bring your data to life—using line graphs, scatter plots, bar graphs, bubble graphs, tables, and more—to communicate with your audience and get your point across.
Built-in styles and color schemes will help your charts look great—whether you’re presenting them, printing them, or publishing them online. You can create multiple views of your data, or combine graph types and include data from multiple datasets in a single graph.
* Create line graphs, scatter plots, bar graphs, bubble graphs, candlestick charts, pie charts, and tables, with drag-and-drop ease.
* The inspector bar gives you control over the content and appearance of your graphs, without clutter or unnecessary complexity. You can quickly add series, choose data values, change graph types, and customize axes, fonts, and colors.
* Graph axes automatically scale to fit your data—or you can move or resize them just by dragging.
* Add best fit curves to scatter plots, or bars or checkmarks to tables.
* Enter formulas to model variables or analyze quantities in a dataset. Whenever the values in the dataset change, the calculations are automatically updated to show the new results.
* Over 80 arithmetic, statistical, logical, calendar, and text functions are available to help you work with your data.
* Import or export CSV files. Save graphs and charts as JPEG, PNG, TIFF, or PDF files, or copy & paste them into other apps.
Compatibility: OS X 10.9 or later, 64-bit processor
Home Page - https://itunes.apple.com/us/app/lively-logic/id538388834?mt=12

------------------------------------------------------------------------------------------
Top Rated News
- MRMockup - Mockup Bundle
- Finding North Photography
- Sean Archer
- John Gress Photography
- Motion Science
- AwTeaches
- Learn Squared
- PhotoWhoa
- Houdini-Course
- Photigy
- August Dering Photography
- StudioGuti
- Creatoom
- Creature Art Teacher
- Creator Foundry
- Patreon Collections
- Udemy - Turkce
- BigFilms
- Jerry Ghionis
- ACIDBITE
- BigMediumSmall
- Boom Library
- Globe Plants
- Unleashed Education
- The School of Photography
- Visual Education
- LeartesStudios - Cosmos
- Fxphd
- All Veer Fancy Collection!
- All OJO Images
- All ZZVe Vectors


 Categories


