Categories: Tutorials

Lynda - Learning Data Visualization
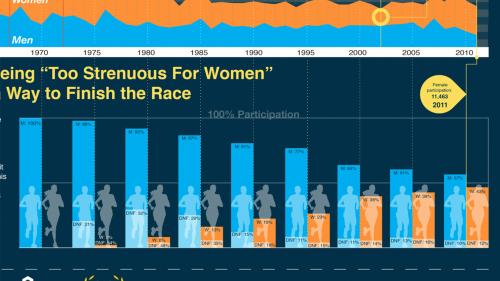
Got a big idea? You need to get it across quickly and efficiently, or modern audiences will move on to the next story clamoring for their attention. Data visualization allows you to make the complex simple, the abstract tangible, and the invisible (data) visible with great illustrations. In this course, Bill Shander shows how to understand your data and your audience, craft the story you need to tell, and determine the best visual model and details to use for that story.
Table of Contents
Related Posts
Information
Members of Guests cannot leave comments.
Top Rated News
- Finding North Photography
- Sean Archer
- John Gress Photography
- Motion Science
- AwTeaches
- Learn Squared
- PhotoWhoa
- Houdini-Course
- Photigy
- August Dering Photography
- StudioGuti
- Creatoom
- Creature Art Teacher
- Creator Foundry
- Patreon Collections
- Udemy - Turkce
- BigFilms
- Jerry Ghionis
- ACIDBITE
- BigMediumSmall
- Boom Library
- Globe Plants
- Unleashed Education
- The School of Photography
- Visual Education
- LeartesStudios - Cosmos
- Fxphd
- All Veer Fancy Collection!
- All OJO Images
- All ZZVe Vectors


 Categories


