
Lynda - Excel Data Visualization Part 1: Mastering 20+ Charts and Graphs
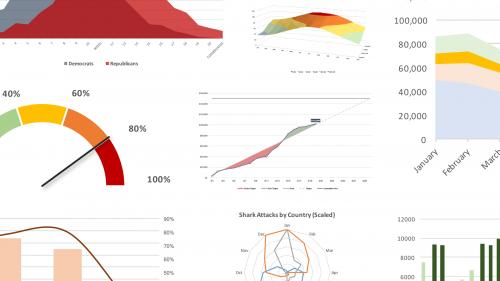
When you think data visualization, you might not think Microsoft Excel. But Excel offers a large number of charts and graphing tools that complement its data analysis toolset. This course offers a laser-focused, practical guide to over 20 useful Excel charts and graphs for data visualization. Instructor Chris Dutton reviews the key principles of data visualization, and provides some introductory tips to help you customize any kind of chart in Excel. In this section, you can learn how to adjust text and cell formatting, change the chart type and axes, and leverage built-in templates. In chapter three, Chris reviews the different chart types: from basic bar and pie charts, to scatter plots, histograms, funnel charts, and sparklines. Plus, learn how to create geospatial heat maps and 3D power maps, and combine different chart types on one sheet.
Table of Contents


Related Posts
Information
Members of Guests cannot leave comments.
Top Rated News
- Sean Archer
- John Gress Photography
- Motion Science
- AwTeaches
- Learn Squared
- PhotoWhoa
- Houdini-Course
- Photigy
- August Dering Photography
- StudioGuti
- Creatoom
- Creature Art Teacher
- Creator Foundry
- Patreon Collections
- Udemy - Turkce
- BigFilms
- Jerry Ghionis
- ACIDBITE
- BigMediumSmall
- Boom Library
- Globe Plants
- Unleashed Education
- The School of Photography
- Visual Education
- LeartesStudios - Cosmos
- Fxphd
- All Veer Fancy Collection!
- All OJO Images
- All ZZVe Vectors
 Categories


