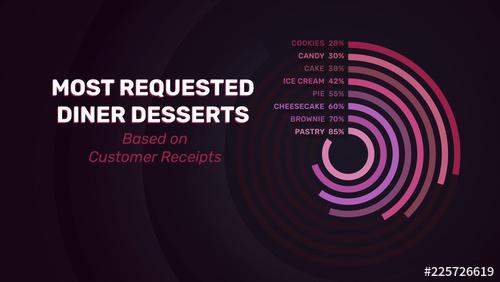
Data-Driven Circle Chart Infographic - 225726619
MOGRT | 00: | Premiere Pro | 1920x1080 | 220.74 KB
Template details:
- A data-driven circle chart infographic with harmonious colors.
- 1920 x 1080 px
- Edit embedded data set or use custom CSV
- Up to 12 data inputs
- Disclaimer: May run slow on lower end computers
- Optimized for Premiere Pro
Related Posts
Information
Members of Guests cannot leave comments.
Top Rated News
- MRMockup - Mockup Bundle
- Finding North Photography
- Sean Archer
- John Gress Photography
- Motion Science
- AwTeaches
- Learn Squared
- PhotoWhoa
- Houdini-Course
- Photigy
- August Dering Photography
- StudioGuti
- Creatoom
- Creature Art Teacher
- Creator Foundry
- Patreon Collections
- Udemy - Turkce
- BigFilms
- Jerry Ghionis
- ACIDBITE
- BigMediumSmall
- Boom Library
- Globe Plants
- Unleashed Education
- The School of Photography
- Visual Education
- LeartesStudios - Cosmos
- Fxphd
- All Veer Fancy Collection!
- All OJO Images
- All ZZVe Vectors


 Categories


