Lynda - Creating Interactive Presentations with Shiny and R
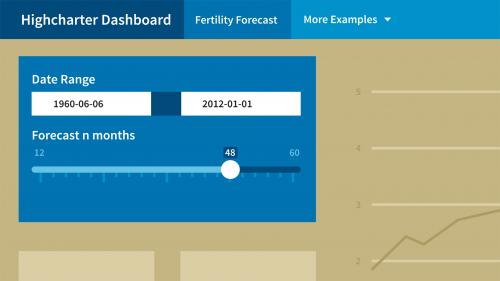
Analyzing big data is great, but not if you can't share your results. In this course, Martin Hadley shows how to create interactive presentations of large data sets with R, RStudio, and Shiny, an R-based tool for producing interactive, web-ready data visualizations. Learn why these tools are important to data scientists, how to configure and install them, and how to use them to make your findings more clear and engaging.
Table of Contents
Related Posts
Information
Members of Guests cannot leave comments.
Top Rated News
- MRMockup - Mockup Bundle
- Finding North Photography
- Sean Archer
- John Gress Photography
- Motion Science
- AwTeaches
- Learn Squared
- PhotoWhoa
- Houdini-Course
- Photigy
- August Dering Photography
- StudioGuti
- Creatoom
- Creature Art Teacher
- Creator Foundry
- Patreon Collections
- Udemy - Turkce
- BigFilms
- Jerry Ghionis
- ACIDBITE
- BigMediumSmall
- Boom Library
- Globe Plants
- Unleashed Education
- The School of Photography
- Visual Education
- LeartesStudios - Cosmos
- Fxphd
- All Veer Fancy Collection!
- All OJO Images
- All ZZVe Vectors


 Categories


