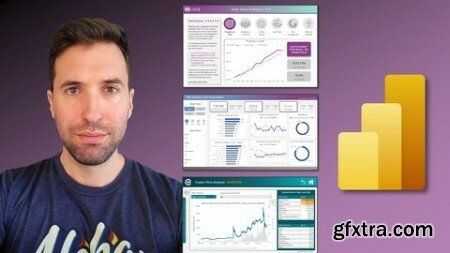
Learn how art, psychology, design, data, and business acumen combine to create incredible Microsoft Power BI tools.
Microsoft Power BI: The Art of Designing Incredible Tools is a course focused on what it means to design beautiful reports and dashboards. Are you a Power BI builder struggling with how to design tools that look as amazing on the front-end as they are in the back-end? You're in the right place! Where other wonderful courses teach the technical aspects of Power BI that help aspiring BI engineers wrangle data, transform it, visualize it, and publish tools across their company, this course is focused specifically on the art of designing tools that look amazing, tell meaningful data stories, and deliver a wonderful online user experience. In this course, learn about some foundational design techniques based in Gestalt psychology, learn how to refine your use of color to make the most important insights "pop", learn how data storytelling is very different from traditional narrative storytelling, and learn about the many things that BI tools and video games have in common when it comes to user experience. In 15 hours, you're not guaranteed to learn everything there is to learn about design and data storytelling, but you will receive the exposure necessary to elevate your BI tools from collections of data visuals into gorgeous "tools" that marry data visualization, design, color, text, imagery, and other stylistic elements in order to invite your users into your creations. Who this course is for: This course is focused specifically on Power BI users who are comfortable building data visuals like bar charts, line charts, etc. and have little difficulty modeling their data, but who struggle with designing attractive and user-friendly reports. This course is focused on teaching useful design principles, basic web navigation features, and data storytelling. Non-Power BI professionals should find many of the design techniques in this course more or less universal but the course will examine BI tool design exclusively from a Power BI perspective. This course is not intended for users looking to build their DAX skills or learn how to construct/customize data visuals. It will focus almost exclusively on higher-level design techniques, as this is an area that I seldom see covered in other BI trainings, which tend to focus on more specific "how do I build this?" areas. This course will focus on "how do I design this?"
Top Rated News
- Sean Archer
- AwTeaches
- Learn Squared
- PhotoWhoa
- Houdini-Course
- Photigy
- August Dering Photography
- StudioGuti
- Creatoom
- Creature Art Teacher
- Creator Foundry
- Patreon Collections
- Udemy - Turkce
- BigFilms
- Jerry Ghionis
- ACIDBITE
- BigMediumSmall
- Boom Library
- Globe Plants
- Unleashed Education
- The School of Photography
- Visual Education
- LeartesStudios - Cosmos
- All Veer Fancy Collection!
- All OJO Images
- All ZZVe Vectors


