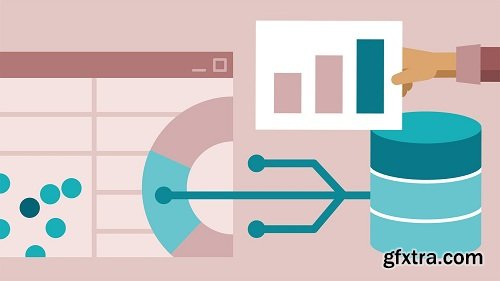
Lynda - Access 2016: Building Dashboards for Excel
MP4 | Video: 720p | Duration: 1:52:14 | English | Subtitles: VTT | 352.6 MB
MP4 | Video: 720p | Duration: 1:52:14 | English | Subtitles: VTT | 352.6 MB
Using Excel, you can optimize reporting for Access databases. Learn how to build powerful dashboards to visualize your data, using tools such as slicers, timelines, charts, and PivotCharts. Instructor Robin Hunt shows how to analyze, query, and export Access data for use in Excel, and connect directly to Access from Excel, so that you always have a live view of your data. Then learn how to build dashboards with slicers, timelines, and charts, and create macros that make your dashboards more user friendly. By the end of the course, you should be able to extend your current reporting capabilities and create more engaging visualizations.
Related Posts
Information
Members of Guests cannot leave comments.
Top Rated News
- Sean Archer
- AwTeaches
- Learn Squared
- PhotoWhoa
- Houdini-Course
- Photigy
- August Dering Photography
- StudioGuti
- Creatoom
- Creature Art Teacher
- Creator Foundry
- Patreon Collections
- Udemy - Turkce
- BigFilms
- Jerry Ghionis
- ACIDBITE
- BigMediumSmall
- Boom Library
- Globe Plants
- Unleashed Education
- The School of Photography
- Visual Education
- LeartesStudios - Cosmos
- All Veer Fancy Collection!
- All OJO Images
- All ZZVe Vectors


