
Lynda - Creating Illustrator Infographics
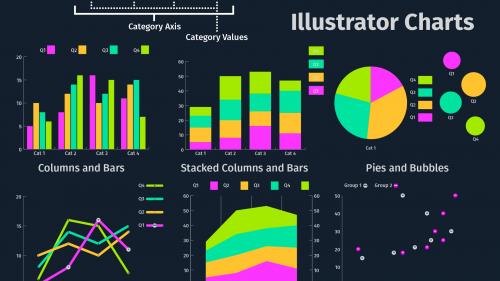
Infographics are everywhere. These data-driven illustrations visualize your data and help to tell the story behind it. In this course, Tony Harmer shows how to design charts, graphs, and other infographic components in Adobe Illustrator. He explains how to develop your core skills—including the ability to customize standard charts and manage large documents—and reveals the key components of a great information design. He then takes you through the various types of charts and graphs that you can use in infographic production, before wrapping with some tips for exporting your final product and sourcing and refining your data.


Related Posts
Information
Members of Guests cannot leave comments.
Top Rated News
- Sean Archer
- AwTeaches
- Learn Squared
- PhotoWhoa
- Houdini-Course
- Photigy
- August Dering Photography
- StudioGuti
- Creatoom
- Creature Art Teacher
- Creator Foundry
- Patreon Collections
- Udemy - Turkce
- BigFilms
- Jerry Ghionis
- ACIDBITE
- BigMediumSmall
- Boom Library
- Globe Plants
- Unleashed Education
- The School of Photography
- Visual Education
- LeartesStudios - Cosmos
- All Veer Fancy Collection!
- All OJO Images
- All ZZVe Vectors
