Categories: Tutorials

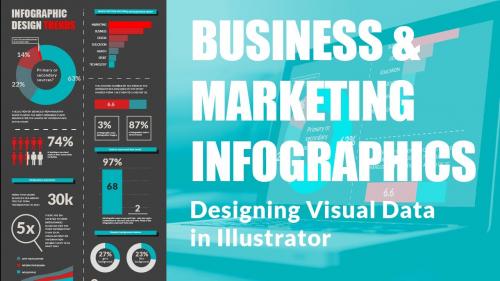
SkillShare - Business & Marketing Infographics: Designing Visual Data in Illustrator
Intermediate level
About This Class Hello my name is Rachel and I am a freelance designer creating infographics & illustrations for content marketing companies, entrepreneurs & small businesses and I love creating infographics & bringing data to life using Adobe Illustrator. In this course, you will learn how to create an infographic creating graphs, pictograms and icons, integrating them with text to tell a story. I will show you how to design the visuals for your infographic to look appealing using a defined colour scheme with graphs, icons & text. Some previous experience in Illustrator would be useful for this course although not essential.
Related Posts
Information
Members of Guests cannot leave comments.
Top Rated News
- Sean Archer
- AwTeaches
- Learn Squared
- PhotoWhoa
- Houdini-Course
- Photigy
- August Dering Photography
- StudioGuti
- Creatoom
- Creature Art Teacher
- Creator Foundry
- Patreon Collections
- Udemy - Turkce
- BigFilms
- Jerry Ghionis
- ACIDBITE
- BigMediumSmall
- Boom Library
- Globe Plants
- Unleashed Education
- The School of Photography
- Visual Education
- LeartesStudios - Cosmos
- All Veer Fancy Collection!
- All OJO Images
- All ZZVe Vectors


