
Categories: Tutorials
Lynda - Excel: Creating a Basic Dashboard
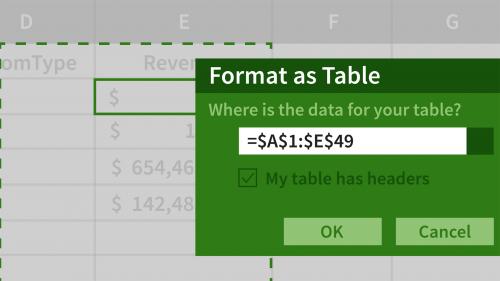
Learn easy-to-implement techniques that can help you quickly create a visual representation of your data to inform your decision making. In this brief course, Curt Frye walks through the basics of creating a dashboard in Excel. Curt begins with a primer on using PivotTables—one of the most powerful data analysis tools in Excel. He also shares how to define conditional formats and summarize your data with sparklines and charts. Plus, he shows how to set up your dashboard worksheet, link data to cells and shapes, maximize your screen space by hiding rows, and modify the Excel program window to meet your needs.
Table of Contents


Related Posts
Information
Members of Guests cannot leave comments.
Top Rated News
- Sean Archer
- AwTeaches
- Learn Squared
- PhotoWhoa
- Houdini-Course
- Photigy
- August Dering Photography
- StudioGuti
- Creatoom
- Creature Art Teacher
- Creator Foundry
- Patreon Collections
- Udemy - Turkce
- BigFilms
- Jerry Ghionis
- ACIDBITE
- BigMediumSmall
- Boom Library
- Globe Plants
- Unleashed Education
- The School of Photography
- Visual Education
- LeartesStudios - Cosmos
- All Veer Fancy Collection!
- All OJO Images
- All ZZVe Vectors
