Data Dashboards in Power BI
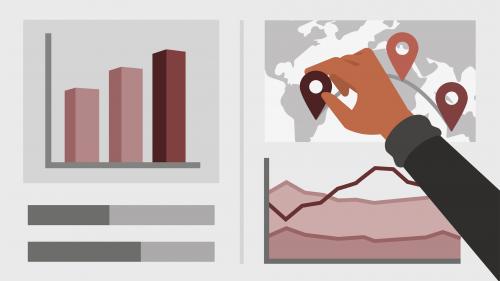
Power BI is a powerful data analytics and visualization tool that allows business users to monitor data, analyze trends, and make decisions. In this course, Helen Wall focuses on the front end of the Power BI application—the dashboard—where users interact with charts and graphs that communicate trends in their data. Throughout this course, Helen steps through how to design and customize the setup of visuals and charts to make it easy to use, understand, and interact with the dashboard model. Learn how to work with data from open-source websites, create visuals such as heatmaps and sparklines, compare multiple variables with trendlines and violin plots, and build engaging maps. To wrap up, she demonstrates how to create and share your finished product: an intuitive, engaging dashboard.
Related Posts
Information
Members of Guests cannot leave comments.
Top Rated News
- Sean Archer
- AwTeaches
- Learn Squared
- PhotoWhoa
- Houdini-Course
- Photigy
- August Dering Photography
- StudioGuti
- Creatoom
- Creature Art Teacher
- Creator Foundry
- Patreon Collections
- Udemy - Turkce
- BigFilms
- Jerry Ghionis
- ACIDBITE
- BigMediumSmall
- Boom Library
- Globe Plants
- Unleashed Education
- The School of Photography
- Visual Education
- LeartesStudios - Cosmos
- All Veer Fancy Collection!
- All OJO Images
- All ZZVe Vectors


